Download Supplementary Movies (Extended)
Movie S1: [mpeg] [youtube]
 Video of a feeding experiment of 10 pigeons
(group A) including an overlay of Feeding-Queuing (FQ) interactions.
Video of a feeding experiment of 10 pigeons
(group A) including an overlay of Feeding-Queuing (FQ) interactions.
The concentric circles indicate the outer boundaries of the Feeding and Queuing ranges.
Feeding birds are marked with red IDs, Queuing with blue. White lines show FQ interactions.
Movie S2: [mpeg] [youtube]
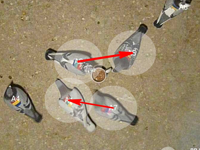 Video of a feeding experiment of 10 pigeons (group A) including an overlay
of Pecking Order (PO) and Approach-Avoidance (AA) interactions.
Video of a feeding experiment of 10 pigeons (group A) including an overlay
of Pecking Order (PO) and Approach-Avoidance (AA) interactions.
White spotlights indicate manually identified PO interactions, coded in the top left corner
(see Materials and Methods). Red arrows indicate AA interactions. For this purpose,
AAij was averaged over a 0.5 s time window. An AA interaction is
indicated with an arrow at time t, pointing from bird i (the approaching bird) towards bird j
(the one that avoids the approach). To more clearly illustrate the most relevant interactions,
we only display arrows where AAij(t) ≥ 0.8, AAji(t) ≤ -0.5, and
dij(t) ≤ 30 cm.
Movie S3: [mpeg] [youtube]
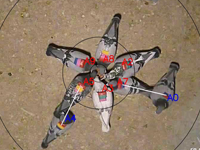
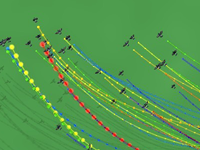 Animation showing free flight by 30 pigeons, all equipped with GPS.
Video speed is 2x real speed (10x when most of the birds are landed).
Individuals are colored according to their rank
in the hierarchy (top right), determined by pairwise directional correlation delay
times for the whole flight. Colors near the red end of the spectrum indicate higher
leadership on average. The top six momentary leaders (see Supplementary Materials and Methods)
are indicated by larger dots on the trajectories and white dots on the hierarchy network.
The white bars under nodes in the network show the amount of time individuals were among the top six birds.